Cryptocurrency graphs play a pivotal role in helping investors make informed decisions in the volatile world of digital assets. Deciphering these graphs requires a nuanced understanding of the various indicators and patterns that influence price movements. In this comprehensive analysis, we will explore the key components of crypto graphs and equip investors with the knowledge needed to navigate the complex landscape.
- Introduction to Crypto Graphs: Cryptocurrency graphs visually represent the price movements of digital assets over time. They are essential tools for investors seeking to understand market trends, identify potential entry or exit points, and manage risk. The two main types of crypto graphs are line charts and candlestick charts, each offering unique insights into market behavior.
- Line Charts: Line charts provide a simplified view of an asset’s price history by connecting closing prices with a line. While they are user-friendly, line charts lack the depth of information found in candlestick charts. Investors often use line charts for a quick overview of general price trends over a specified period.

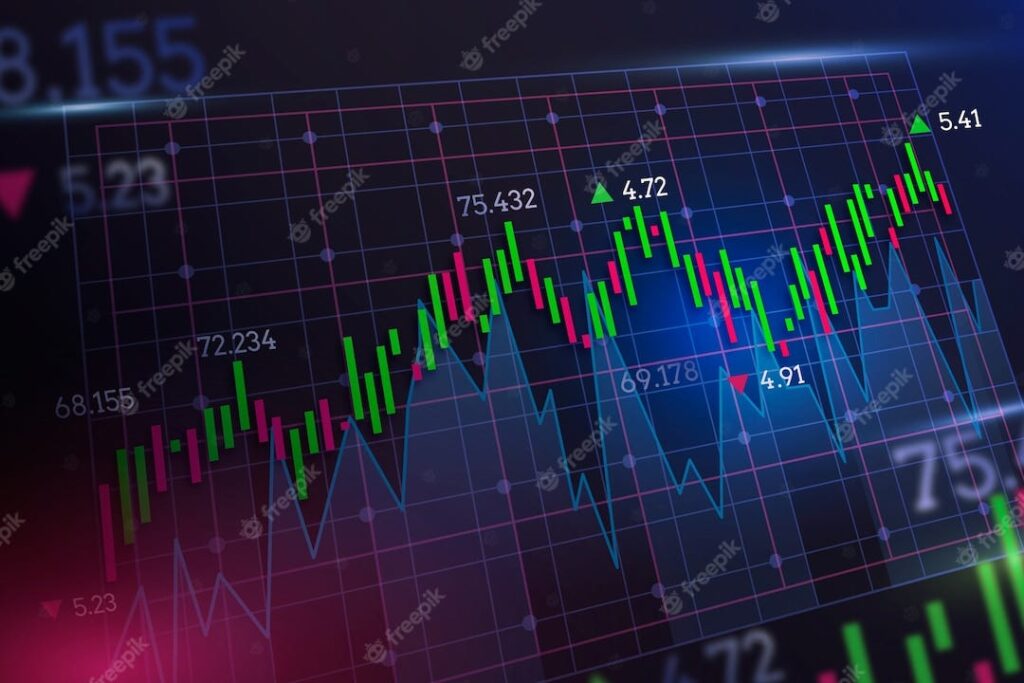
- Candlestick Charts: Candlestick charts are more detailed and widely used for in-depth analysis. Each candlestick represents a specific time frame, displaying the opening, closing, high, and low prices. The body of the candlestick is colored to indicate whether the price increased (green or white) or decreased (red or black). Candlestick patterns, such as doji, hammer, and engulfing, convey valuable information about market sentiment.
- Understanding Trends: Trends are the foundation of technical analysis in the cryptocurrency market. A trend can be upward (bullish), downward (bearish), or sideways (neutral). Investors use trendlines to identify and confirm trends, helping them make strategic decisions. Recognizing the direction of the prevailing trend is crucial for successful trading.
- Support and Resistance Levels: Support and resistance levels are key concepts in technical analysis. Support represents a price level at which an asset often bottoms, while resistance is a level at which it frequently tops. Identifying these levels helps investors anticipate potential price reversals or breakouts, aiding in risk management and decision-making.
- Indicators and Oscillators: Various technical indicators and oscillators complement crypto graphs by providing additional insights into market dynamics. Popular indicators include Moving Averages (MA), Relative Strength Index (RSI), and Moving Average Convergence Divergence (MACD). Integrating these tools into chart analysis enhances the ability to spot trends and potential entry or exit points.
- Volume Analysis: Volume is a critical factor in analyzing crypto graphs. Volume represents the number of trades executed during a specific time frame. Changes in volume can indicate the strength or weakness of a price movement. Volume analysis is particularly useful for confirming trends and identifying potential reversals.
- Pattern Recognition: Chart patterns, such as head and shoulders, triangles, and flags, provide valuable information about potential future price movements. Recognizing these patterns can help investors anticipate trend reversals or continuation, providing a strategic advantage in decision-making.
- Risk Management Strategies: Armed with a comprehensive understanding of crypto graphs, investors can implement effective risk management strategies. Setting stop-loss orders, diversifying portfolios, and adjusting position sizes based on market conditions are essential practices to mitigate potential losses.
- Conclusion: Decoding crypto graphs is a skill that evolves with experience and continuous learning. Investors who master the art of chart analysis gain a competitive edge in navigating the dynamic cryptocurrency market. By combining technical analysis with fundamental research, investors can make well-informed decisions and thrive in the ever-changing landscape of digital assets.